Key figures of the evaluation report
The evaluation you receive by e-mail is generated in a standardised way using the evasys evaluation software.
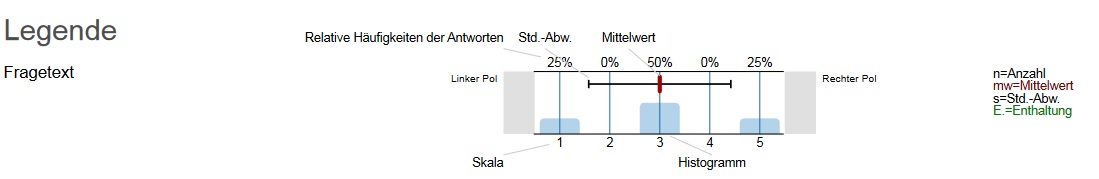
It contains a graphic illustration for closed questions in the case of scale questions (see Fig. 1):
The histogram enables you to better estimate the distribution of answers per question.
At TUDa, scales with 5 response categories are usually used. These form the basis of the histogram. The percentage frequencies given above the bars refer to the distribution of the valid answers of the students.
Next to the histogram you will find the following key figures:
- The number of responses (n) available in each case
- The respective average value of the answers given (mw ≙ arithmetic mean)
- The standard deviation (s) for the mean.
Note: The larger the standard deviation, the more heterogeneous is the response behaviour of the students. The students therefore view the questioned aspect very differently. To get a complete picture, therefore, be sure to look at the graphic illustration, which shows the percentage frequencies of the individual scale points. - the number of abstentions (E)
In addition to the evaluation of the individual questions in the first section of the evaluation, there is another section in which the results are presented as a profile line. The profile line represents the respective mean values per question. In addition, the valid number of answers (n) and the mean value in numbers (mw) are shown next to the profile line.
On request, we can add further comparison profile lines for you in addition to your own profile line. You can find out more about this further down this page under “Further options for classifying the results”.
Disadvantages of using the arithmetic mean
The arithmetic mean is sensitive to outliers. Particularly in small courses – and thus a small number of responses in the course evaluation – “extreme” responses can distort the arithmetic mean.
Therefore, be sure to pay attention to the standard deviation and the graphical illustration that shows the distribution of the values!
